Pass percentages are trash. News to nobody.
As has been covered by much, much smarter people than us, not all passes are equal. Pass quality needs to be measured with much more nuance than simply successful or unsuccessful.
Great approaches to this problem have modelled the goalscoring opportunity created when a pass reaches a certain area, or applied an expected goals philosophy to passes.
In this piece, we are going to go a different route. Instead of building a model on a huge dataset of passes, we are going to use an Elo rating system for all passes in the 2018 World Cup.
We are hopeful that the approach will give us a unique view on passers and passes, and help to answer a number of questions around recruitment, tactics and coaching. Who are the best passers in each scenario? Are there any pass types that are hopeless? What are the easiest ways to get the ball where we want it?
This article will introduce the process taken and go over some of the initial findings from it. But first…
What is Elo?
Elo is best known for ranking chess players. The rankings of each player give a probability of winning and are used to assign new scores once there is a winner. Over time, of course, the better players gain higher scores, but they will gain fewer points from beating lower-ranked players. Whereas lower ranked players will gain more points by beating top players.
In football, it has already been applied to football match results and aerial duels. Both are phenomenal projects and inspirations for the work here.
So you may think, how can you use this to rank passers? There is only one passer and no opponent.
To solve this, we are going to use the type of pass as an opponent. A 10 yard pass from CB to CB should be easy, so will eventually become be a ‘weak’ competitor according to Elo. Conversely, a zone 14 pass into the box should be a lot tougher, giving a high reward to your ranking if you make it.
Process
Using the 2018 World Cup dataset from Statsbomb, we have dataset of 63,000 passes. For the sake of calculating an Elo rating, it might help to think of each pass as a contest.
The ‘contests’ are between the player and the pass type. The pass type in this introduction is simply the location (in bins) of the pass start and end points. This gives us an example match-up like this:
Andres Iniesta vs 60-30–30-30
(Player) vs (x,y pass origin bin — x,y pass destination bin)
If the pass reaches their own team, the player wins the contest. If it does not, the pass wins. With this information, an updated Elo score is assigned to both the player and the pass.
In this iteration, there are 600 players and 1,684 pass types that make up our roster in the contests.
This process runs through all passes in the dataset, leaving us with final ratings and the rating points won or lost with each pass – for both players and pass types.
————————
Results
Let’s start with the obvious – who are the best passers in the ratings?
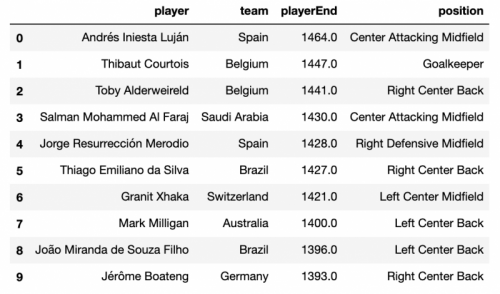
Iniesta at the top passes the eye test. Not necessarily just for his quality, but remembering the Russia match (and others) where Spain dominated the ball, but repeatedly horse-shoed around the box.
Two Belgium players next also makes sense. Their run to the 3rd/4th playoff means more games to increase their rating, and easier passes to be made consistently at the back.
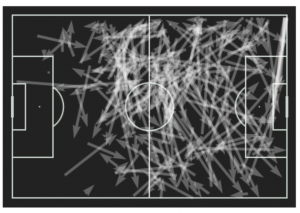
Al Faraj in number four is a surprise. Regrettably, I have no idea on his quality, but a quick pitch map shows loads of pivoting passes and some attempts to break into the final third.
But as you can see in the table, we get plenty of possession recyclers and defenders in our leading players. Boring.
We could filter by position, but let’s instead just look at the net points gained from passes starting ending in the final third of the pitch:
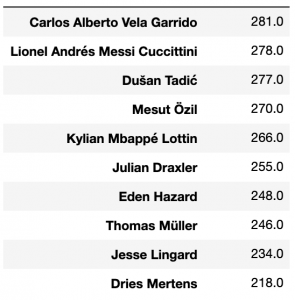
That’s the stuff ❤️
Carlos Vela leading the scores here, always thought he had the edge on Messi. Looking at the map, Vela has indeed put in plenty of passes ending in dangerous positions within the final third:
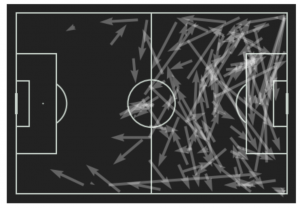
And how about if we want to check out the players gaining most points including only on passes on the right wing?
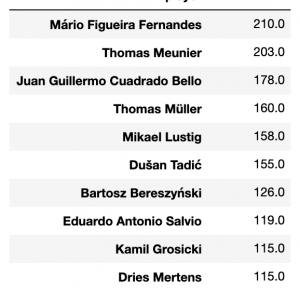
Interesting to see right backs up towards the top rather than wingers. Let’s check out Russia & CSKA’s Fernandes:
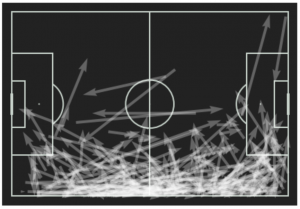
Loads of attacking activity from the right wing, as his place in the table suggests.
Finally, and a question worth its own article, who made the most Elo points from passes under pressure?
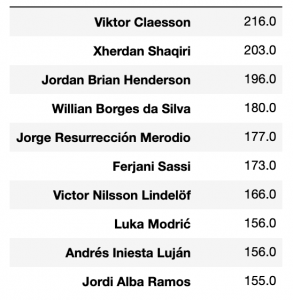
Always a pleasure to see Henderson rightfully among the elites.
————————
Applications
So what can we do with the data here?
Highlighting skilled passers is obvious. Not just with a blanket approach, but you can filter the passes with the extra data collected by Statsbomb. Filter for type of possession, pressure and location.
We have already seen right backs dominating the passes in the right wing space. Does this information, and similar nuggets from the data, shift any thoughts on coaching, especially outside of the elite level?
Having information on how a team successfully breaks lines, moves the ball through the thirds and who they key movers is clearly applicable to opposition scouting.
And we haven’t even started to look at the data from the perspective of good & poor pass selection.
————————
Improvements & Conclusions
There are plenty of ways to improve this application.
Firstly, the approach only looks at where the passes start & end. Statsbomb’s dataset is incredibly rich and these details could lead to further pass classifications.
Secondly, the World Cup dataset contains 64 games, with a player likely playing only 3 or 4. This is not a huge amount of data to judge players or passes. Ideally, this would be run over at least a season’s worth of league data.
Finally for now, the numbers aren’t adjusted for playing time. Adjusting the points gained by 90s played should give us some fairer figures and maybe shine a light on some hidden players. Especially combined with point 2.
Despite all of this, we really like this approach as a fairly novel way of assessing passes. On an initial run in this introduction, it does well on the eye test and gives us some interesting names from a well-known tournament.
Future articles making use of this approach will look at players and positions in greater depth, as well as look at which the worst types of passes are and who is guilty of relying on them way too much.
Let us know what you think of the approach @fc_python and if you have any thoughts on what we can answer with this dataset.

